
This is the blog of a modern day Cartographer thrown into the business world. Over the course of my journeyman's career I have wandered through positions in government, news agencies, consulting corporations and rogue start ups. The hard-earned working theory I have developed is simple. In life, communication is hard work. In business, effective communication is critical. Hence, this blog parallels the location Intelligence practices on www.GeoSteppes.com.
Esri News Feed
Wednesday, December 31, 2008
When in Bentonville, Arkansas ....

Friday, October 31, 2008
Wednesday, October 22, 2008
Bean Counters Drink their Way to Presidency

Which way to Mecca?
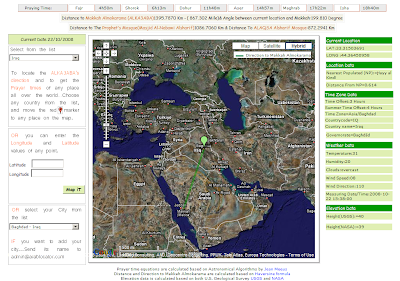
The green box details provide geo-speciific data. for example:
Current Location
LAT: 33.063924198120645
LONG : 44.560546875
Location Data
Nearest Populated (NP):=Shaykh Muţlaq al Ghuḑayb
Distance From NP=0.6467
Time Zone Data
Time Offset: 2 Hours
Summer Time Offset:3 Hours
Time Zone=Europe/Simferopol
Countrycode=UA
Country name=Ukraine
Governorate=Wāsiţ
Weather Data
Temperature: 31
Humidity: 20
Clouds:overcast
Wind Speed: 08
Wind Direction: 110
Measuring Date/Time:2008-10-22 15:38:00
Elevation Data
Height(USGS):=25
Height(NASA):=34
Cool Geo-Pic: Salt Water Lakes in Antarctica
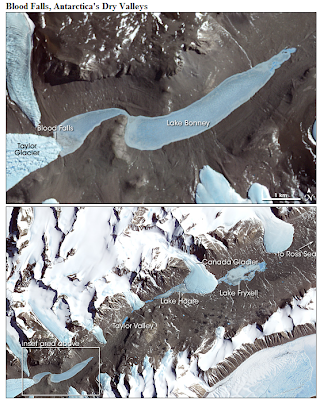
The researchers also offered an explanation for why Lakes Bonney and Fryxell are saltwater, but Lake Hoare is freshwater. As the Ross Sea retreated, leaving behind a saltwater lake, the Canada Glacier was also advancing. At some point, the researchers think, the Canada Glacier advanced so far into Taylor Valley that it cut off the inland part from the sea. Saltwater lakes were left on either side, and a new freshwater lake, Lake Hoare, formed from glacial melt water on the lower (inland) side of the Canada Glacier. Confirmation of these hypotheses will come from continued drilling of sediment and ice cores in these Dry Valley lakes. ..."
NASA image created by Jesse Allen, using data provided courtesy of NASA/GSFC/METI/ERSDAC/JAROS, and U.S./Japan ASTER Science Team. Caption by Rebecca Lindsey.
Thursday, October 16, 2008
Geo-Mash up in Florida politics

Here is a nice example of using google mash ups to geo-visually communicate political information. While I have my presidential leanings in this year's election, this is not to sway anyone to toward either candidate - more to highlight the example of the slick technology for purpose (benefit or sly persuasion - you decide) for communicating local legislative issues via the map. My guess is the RNC is as good at it as the DNC. Its a wonderful way to tie regional issues in a "browsable" format.
For the full website - click here
To see Click2Map's google mash-up tool - click here
The Click2Map blog has some interesting posts on GooCar and Geo-Targeting.
Wednesday, October 15, 2008
Why I need a new car to save the planet

Well, in this case the map says it all.
Taken from ESRI's MapMPG.com (beta) - the site lets you compare how far two different cars can go on one gallon of gas.
My "cut & paste" example compares "my old but paid for truck" – a 1997 Isuzu Trooper contrasted with a burn rate of today's "auto-green darling" - a Toyota Prius.
As soon as the home budget allows for a new car payment, I think the choice of purchase is clear.
Wednesday, October 08, 2008
Cool Geo-Pic: Bouvet Island, South Atlantic Ocean
 Another cool geo-pic from NASA's Earth Observatory.
Click here to view full image (128 kb)
Quick "Cut & Paste" Highlights:
" .... Bouvet Island (in Norwegian, Bouvetøya) is known as the most remote island in the world; Antarctica, over 1600 kilometers (994 miles) to the south, is the nearest land mass. Located near the junction between the South American, African, and Antarctic tectonic plates, the island is mostly formed from a shield volcano—a broad, gently sloping cone formed by thin, fluid lavas—that is almost entirely covered by glaciers. The prominent Kapp (Cape) Valdivia on the northern coastline is a peninsula formed by a lava dome, a volcanic feature built by viscous lavas with a high silica content. It is only along the steep cliffs of the coastline that the underlaying dark volcanic rock is visible against the white snow and ice blanketing the island...."
References:
Astronaut photograph ISS017-E-16161 was acquired on September 13, 2008. with a Nikon D2Xs digital camera fitted with an 800 mm lens, and is provided by the ISS Crew Earth Observations experiment and the Image Science & Analysis Laboratory, Johnson Space Center.
Cool Geo-Pic: Wetland Damage Along the Gulf Coast

Another brilliant NASA image from the Earth Observatory.
Click here to view full image (650 kb)
Quick "Cut & Paste" Highlights:
" .... This photo-like image of the Texas and Louisiana coasts shows the impact of Hurricane Ike’s powerful storm surge on coastal wetlands. Hurricane Ike came ashore over southeast Texas on September 13, 2008, bringing with it a wall of water that stretched from Galveston, Texas, across all of coastal Louisiana. The storm’s surge covered hundreds of kilometers of the Gulf Coast because Ike was a large storm, with tropical-storm-strength winds stretching more than four hundred kilometers from the center of the storm. The strongest storm surge devastated Galveston and the Bolivar Peninsula. Though it was not as hard hit, coastal Louisiana—still trying to dry out from Hurricane Gustav—suffered as well.... "
References:
National Hurricane Center. (2008, September 13). Hurricane Ike. NOAA National Weather Service. Accessed October 1, 2008.
NASA image courtesy Jeff Schmaltz, MODIS Rapid Response Team at NASA GSFC. Caption by Holli Riebeek.
Cool Geo-Pic: Roan Plateau, Colorado

References:
U.S. Bureau of Land Management. (2008, March 13). Roan Plateau Resource Management Plan and Final EIS. Accessed October 2, 2008.
Cool Geo-Pic: Flooding from Hurricane Ike in Texas
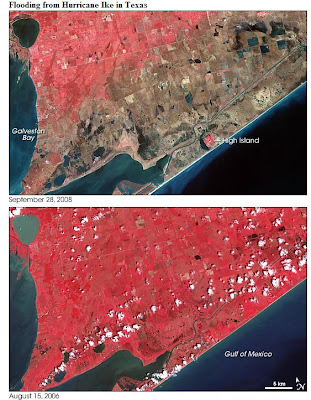 image: Flooding from Hurricane Ike in Texas
Large images
September 28, 2008 (3.6 MB JPEG)
August 15, 2006 (3.2 MB JPEG)
Quick "Cut & Paste" Highlights:
" .... Hurricane Ike came ashore along the U.S. Gulf Coast on September 13, 2008, and the storm’s eye narrowly missed Galveston and Houston. Although the storm produced tremendous damage in both cities, perhaps the greatest damage was caused by the storm surge, which inundated the coastline near Galveston. The storm surge was greatest east of Galveston, reaching 4.6 meters (15 feet) above sea level. The area devastated by the storm surge includes coastline immediately east of Galveston Bay.
These images acquired by the Advanced Spaceborne Thermal Emission and Relfection Radiometer (ASTER) on NASA’s Terra satellite show part of the area scoured by Hurricane Ike. The bottom image, acquired August 15, 2006, shows the region two years prior to Ike’s landfall. The top image, acquired September 28, 2008, shows the region about two weeks after the storm surge.... "
Full Article - Click Here
References:
Aigner, E., Bornemeier, J., Burgess, J., Huang J., Iaboni L., Park H. (2008, September 13). In Ike’s wake. The New York Times. Accessed September 30, 2008.
Dewan, S. (2008, September 15). On peninsula in the storm: No way out. The New York Times. Accessed September 30, 2008.
Drye, W. (2008, September 26). Why Hurricane Ike’s “Certain Death” warning failed. National Geographic News. Accessed September 30, 2008.
Urbina, I. (2008, September 15). After surviving storm, fleeing a fetid, devastated Galveston. The New York Times. Accessed September 30, 2008.
Wikipedia. (2008, September 21). High Island, Texas. Accessed September 30, 2008.
NASA image created by Jesse Allen, using data provided courtesy of
NASA/GSFC/METI/ERSDAC/JAROS, and U.S./Japan ASTER Science Team. Caption by Michon Scott.
Wednesday, September 10, 2008
Cool Geo-Pic: Both Routes Around Arctic Open at Summer's End

___________________________________________
Click here to view full image (179 kb)
Quick "Cut & Paste" Highlight:
" .... As of the first week of September 2008, Arctic sea ice extent had not fallen below the record low observed in 2007, but the season set a new kind of record. For the first time in probably half a century—and definitely since satellite observations began about three decades ago— sea ice retreated enough to create open (not ice-free) waters all the way around the northern ice pack. Open water is defined by the World Meteorological Organization for the purposes of navigation as areas where the ice covers less than one-tenth of the surface ...."
U.S. National Ice Center. (2008, September 5). The Northern Sea Route (Northeast Passage) appears ‘open’ as of Sep 4th, 2008. Posted on NYT.com’s Dot Earth blog. Accessed September 8, 2008.
Further reading
Southern Route Through Northwest Passage Opens
Record Arctic Sea Ice Loss in 2007
Ice Shelves Retreat on Ellesmere Island
NASA image created by Jesse Allen, using data obtained courtesy of the National Snow and Ice Data Center (NSIDC). Caption by Rebecca Lindsey.
Cool Geo-Pic: Sunglint on the Amazon River, Brazil

Click here to view full image (2663 kb)
Quick "Cut & Paste" Highlights:
The setting sun glints off the Amazon River and numerous lakes in its floodplain in this astronaut photograph from August 19, 2008. Large areas of sunglint are common in oblique views (shot from an angle, rather than looking straight down from the spacecraft). About 150 kilometers of the sinuous Amazon is shown here; the area is about 1,000 kilometers inland from the Atlantic Ocean. Arrows show the generally eastward direction of flow of the Amazon. One of the great river’s tributaries, the Uatumã River, enters on the north side of the Amazon (top center). A small side channel, or distributary, of the Madeira River (beyond the left edge of the image) enters the view from the left. Tupinambarama Island occupies the swampy wetlands between the Amazon and Madeira rivers.
Credits:
Cool Geo-Pic: Ice Shelves Retreat on Ellesmere Island

Ice Shelves Retreat on Ellesmere Island
NASA image created by Jesse Allen, using data provided courtesy of the MODIS Rapid Response team. Caption by Michon Scott.
Cool Geo-Pic: Stormy Atlantic - Sept 2008
 ____________________________________________________
Another cool Geo-Pic from NASA:
Click here to view full image (1345 kb)
Quite "Cut & Paste" Highllght:
" .... The Atlantic hurricane season typically peaks in early to mid-September after the ocean’s surface has had time to heat up in the summer sun. As if on cue, a string of storms formed over the Atlantic as September approached during the 2008 hurricane season.
When the GOES satellite captured this view of the atmosphere at 1:45 p.m. Eastern Daylight Time on September 3, four storms were lined up across the Atlantic, and one had developed in the Eastern Pacific. GOES’ view of the clouds are overlaid on the NASA Blue Marble. ...."
Full Article - Click Here
Saturday, August 23, 2008
Cool Geo-Pic: Sulfur Dioxide from Okmok Volcano

Cool Geo-Pic: Earth and the Moon

True-color high quality (9.5 MB QuickTime)
True-color web quality (530 kB QuickTime)
Infrared high quality (10.3 MB QuickTime)
Infrared web quality (570 kB QuickTime)
NASA images and animation courtesy EPOXI science team. Caption by Rebecca Lindsey, adapted from the NASA press release.
Cool Geo-Pic: Cordillera Huayhuash, Peruvian Andes

Another Cool Geo-Pic from NASA's Earth Observatory & the ISS crew.
Cordillera Huayhuash, Peruvian Andes: Click here to view full image (401 kb)
"Cut & Paste" highlights:
" ... Widely considered the most spectacular peak in South America, Yerupajá is so steep that it has seldom been climbed. The best climbing approach is from the southwest, the face seen in this view. Yerupajá is locally known as El Carnicero (“The Butcher”) because of its blade-like ridges, typical of mountains that have been heavily eroded by glacial ice. Other features created by the erosive effect of flowing ice are small glacial lakes, which often vary in color due to different amounts of fine mud being fed into them by meltwater from under the glaciers. During the ice ages, the glaciers advanced many kilometers outward from the cordillera, occupying all the surrounding valley floors (all of which lie above 3,000 meters), producing U-shape valleys.... "
Full Article:
http://earthobservatory.nasa.gov/Newsroom/NewImages/images.php3?img_id=18093
Thursday, July 17, 2008
Save My Airport!

Top 50 Large City Airports at Risk
Top 100 Regional Airports at Risk
Wednesday, July 16, 2008
Cool Geo-Pic: Formation and Decay of Hurricane Bertha
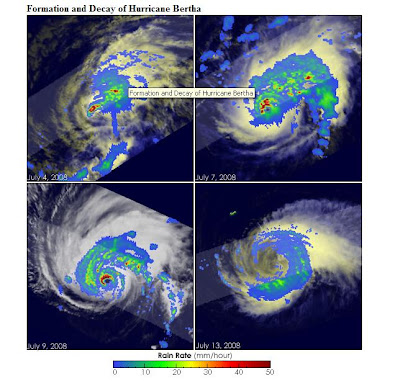
Large images
July 4, 2008 (238 kB JPEG)
July 7, 2008 (212 kB JPEG)
July 9, 2008 (181 kB JPEG)
July 13, 2008 (136 kB JPEG)
Cut & Paste" Highlights:
References:
National Hurricane Center. Hurricane Bertha advisory archive. Accessed July 15, 2008.
Roberts, E. and McFadden, D. (2008, July 15). Tropical Storm Bertha rakes Bermuda. Associated Press. Accessed July 15, 2008.
Images produced by Hal Pierce and caption by Steve Lang and Holli Riebeek.
Cool Geo-Pic: Dakar, Senegal

Another Cool Geo-Pic from NASA's Earth Observatory.
There is something striking about the coast edges that makes this image intriguing.
Click here to view full image (1352 kb)
"Cut & Paste Description" Highlights:
" ....In 2008, one out of every four people living in Senegal lived in the coastal capital of Dakar. Over previous decades, the city spread over the Cap Vert Peninsula as a result of both migration and growing families. In the 1940s, the city occupied just the southern tip of the peninsula. By the beginning of the twenty-first century, cityscape had sprawled both northward and eastward..... "
References:
United Nations Environment Programme. (2008). Africa: Atlas of Our Changing Environment. Division of Early Warning and Assessment, United Nations Environment Programme, Nairobi, Kenya.
Hopkins, B. (2008). Birding in the Dakar area. Seawatching in Senegal.
NASA image created by Jesse Allen, using Landsat data provided by the United States Geological Survey. Caption by Michon Scott.
Cool Geo-Pic: Toshka Lakes, Egypt

"Cut & Paste" Highlights:
" ... In the late 1990s, Egypt’s new manmade Toshka Lakes, fed from Lake Nasser via a canal, grew and spilled into new basins to become four major and two smaller lakes. These lakes extended 120 kilometers across the desert west of the Nile River in southern Egypt. Starting in 2002, astronauts have seen the lakes slowly decline, with the telltale ring of darker, moistened ground showing the previous higher water levels (see prior comparison of astronaut imagery of the lakes). The rise and fall of Toshka Lakes and the economic development surrounding the region are dependent on climate fluctuations and water agreements with upstream countries that, in turn, determine the long-term water flow in the lower Nile.
Cool Geo-Pic: Southern Ocean Carbon Sink
 ----------------------------------------------------------------------------------------------------------------------------------------------------------------------------------------------------------------------------------------------------------------------------------------------------------------------------------------------------------------------------------------------------------------------------------------------------------------------This is an interesting consequence of weather - low carbon absorbtion. As weather patterns may increase to extremes with global climate change - recalcs to absorbtion rates seem re need "rethinking".
" ... As people have put more and more carbon dioxide into the atmosphere, the ocean has responded by soaking up more carbon dioxide—a trend scientists expected to continue for many years. But in 2007, a team of scientists reported in the journal Science that between 1981 and 2004 carbon dioxide concentrations in the Southern Ocean didn’t change at all, even though global atmospheric levels continued to rise. This graph shows the changes scientists expected to see (blue line) compared to their estimate of actual carbon dioxide absorption (red line). The results suggested that the Southern Ocean was no longer keeping pace with human carbon dioxide emissions."
Wednesday, July 09, 2008
Data Display - Change in Airline Service

- This interactive map is a great mix of two of my passions; the intelligent display of complex data and air travel.
Monday, July 07, 2008
Cool GeoPic: Recent Ocean Level Change
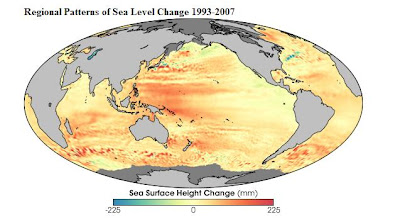
Well, so now we know where is started....
Cut & Paste Highlights:
" ... Unlike the water in a sink or a bathtub, the water level in Earth’s oceans is not the same everywhere; sea level varies with location and time. On time spans of hours to days, sea level is influenced by tides, winds, and waves, including storm surges. Sea level rises when oceans warm, and it drops when they cool (because water expands when it heats up and contracts when it cools). Regional variations in sea level can persist for many years, even a decade. Underlying all these changes is the slower rise and fall in global average sea level as ice ages recede and advance over millenia.
This map shows global patterns of changes in sea level (sea surface height) measured by satellite-based altimeters (Topex and Jason 1 satellites) from 1993 through the end of 2007. Places where the sea surface height increased up to 225 millimeters (about 8.9 inches) are shown in dark red; places where sea level dropped are blue. The most widespread change in sea level over this time period was an increase in the Western Pacific sea surface height. During the period spanned by this image, a climate pattern called the Pacific Decadal Oscillation was in its warm phase, and sea surface temperatures were above average in much of the basin. Thermal expansion during this warm phase would be consistent with a rise in sea level...."
Full Article:
http://earthobservatory.nasa.gov/Newsroom/NewImages/images.php3?img_id=18075
Cool Geo Pic: Where do these images come from?

This one wins for "where the Next Cool Geo-Pics will come from" award.
Click here to view full image (360 kb)
Cut & Paste Highlights:
" When we hear the word topography, most of us think of mountains and valleys on dry land. But the surface of the ocean has topography, too, and the variation in the height of the sea surface from place to place reveals important information about weather, climate, and rising sea level. On June 20, 2008, NASA launched the Ocean Surface Topography Mission (OSTM)/Jason 2 satellite, the latest in a series of U.S./French satellites to collect observations of ocean surface height...."
Full Article:
http://earthobservatory.nasa.gov/Newsroom/NewImages/images.php3?img_id=18069
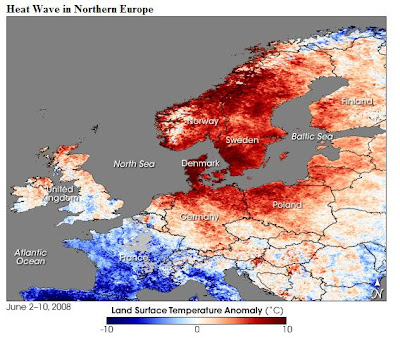
Cool Geo-Pic: Heat Wave in Northern Europe
Tuesday, July 01, 2008
Thursday, June 05, 2008
Friday, May 30, 2008
Join DayJet - Free Membership

If you are interested in learning more and/or signing up, check out this microsite at www.dayjet.com/friends which will provide you with a brief overview. Be sure to enter my promotion code 10000339 in order for the system to waive the membership fee. You need to sign-up by June 30, 2008 in order to take advantage of this offer. Folks who are flying with DayJet are loving it.
I also have provided the following links to some recent video and news coverage on DayJet that you might find interesting. The final link is for testimonials from current DayJet customers:
Here is another great link from our site that helps explain how pricing works...
http://www.dayjet.com/Services/TVPIntro.aspx
Give me your thoughts and tell me what you think. I’ll call you in a few days to follow-up. As always, please forward this to anyone you think may want to join DayJet.
Thanks,
Sinam Al-Khafaji
Marketing Cartographer & Market Planner
Founding Member, DayJet
Sinam@DayJet.com
Desk 561.322.2286
Cell 561.665.0278
Tuesday, May 27, 2008
Cool Geo-Pic: Lake Formation in the Aftermath of Magnitude 7.9 Earthquake

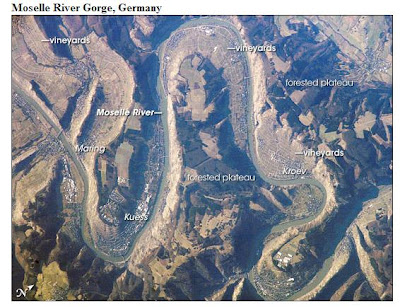
Cool Geo-Pic: Wine country in Moselle River Gorge, Germany
Monday, May 19, 2008
When Geo Strikes Back: Earthquake near Chengdu, China

"Old School" Geo-Pic: William Smith's Geological Map of England

" The eventual outcome of Smith’s research was A Geological Map of England and Wales and Part of Scotland, first published in 1815. On a scale of 5 miles per inch, the map measured 6 feet by 8 feet 6 inches. It was not the world’s first geologic map, but it was the first to map such a large area in such detail.... "
Cool Geo-Pic: Chile's Chaiten Volcano Erupts

Two points that amaze me. The first, this supposed dominant volcano last erupted several millennia BC. The second, the ash plume flow across the entire South American continent to the Atlantic Ocean.
Large Images:
Quick Cut & Paste Description:
" Three days after its surprise eruption on May 2, the Chaitén volcano of southern Chile was still pumping out dense clouds of ash. The plume stretches east from the peak in this pair of images, taken on May 5, 2008, by the Moderate Resolution Imaging Spectroradiometer (MODIS) on NASA’s Terra satellite. ....
" The eruption that started on May 2 was unexpected because Chaitén was thought to have been dormant. Radiocarbon dating of the last lava flow from the volcano suggests that Chaitén last erupted in 7420 BC, plus or minus 75 years, says the Smithsonian’s Global Volcanism Program...."
Full Story at: http://earthobservatory.nasa.gov/Newsroom/NewImages/images.php3?img_id=18020
Tuesday, May 06, 2008
Maps of Religion - a historical timeline


