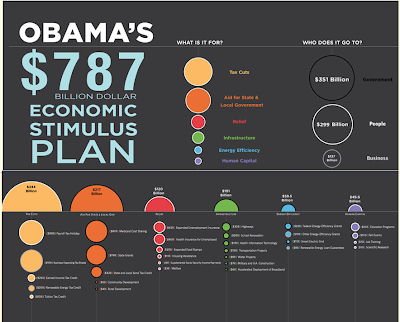
 As funny as it sounds in today's economic times, I need a refresher on where the $800 billion stimulus plan went .... So I dug up some visual displays of Obama's economic plan.
This particular collage comes from InfoGraphics - as first seen on FlowingData
You would think after only six months of spending this type of cash each 100 million would be etched into our brains, but alas .... even nearly a trillion is but a fleeting memory.
I was mostly interested in reviewing the ratio of tax cuts to aid to local/state governments given the State of California's recent budget debacle.
As always, the visual provides some clarity (at least as to the categories of spend) on how to interpret the data.
 Taken from the California Economic Recovery Portal, a brilliant interactive display of stimulus spend throughout the state of California. My image collage highlights Orange County.


