This image and hyperlink comes from Norse to highlight there Dark Matter platform.
Per the company's website - " .... The patented Norse DarkMatter platform is a globally-distributed "distant early warning" network of thousands of sensors, honeypots, and crawlers that continuously analyzes Internet traffic to identify compromised hosts, malicious botnets, anonymous proxies, and other sources of digital attack. Processing hundreds of terabytes daily, the DarkMatter™ attack intelligence platform continuously computes over 1,500 distinct risk factors for millions of IP addresses every day...."
Good stuff, but the visualization really brings it to life. It immediately reminds us of a global thermonuclear warfare simulation a-la internet attacks.
Definitely check out Norse - IP Viking-Live
This is the blog of a modern day Cartographer thrown into the business world. Over the course of my journeyman's career I have wandered through positions in government, news agencies, consulting corporations and rogue start ups. The hard-earned working theory I have developed is simple. In life, communication is hard work. In business, effective communication is critical. Hence, this blog parallels the location Intelligence practices on www.GeoSteppes.com.
Esri News Feed
Thursday, September 11, 2014
Cool Geo-Pic: Mapping Internet Attacks
Labels:
DarkMatter,
Geo-Pic,
Internet Security,
Norse
Monday, September 08, 2014
Cool Geo-Video: Earth's Magnetic Field
Source: NASA's Earth Observatory
Quick "Cut & Paste" Summary:
"....Launched in November 2013 by the European Space Agency (ESA), the three-satellite Swarm constellation is providing new insights into the workings of Earth’s global magnetic field. Generated by the motion of molten iron in Earth’s core, the magnetic field protects our planet from cosmic radiation and from the charged particles emitted by our Sun. It also provides the basis for navigation with a compass...."
" ....Geophysicists have noted that the strength of Earth’s magnetic field has been decaying—about 5 percent globally over the past century. However, it is not changing in a uniform way; it grows growing stronger in some places and weaker in others. ...."
"....[t]he changes are a natural variation due to processes in the deep interior of the Earth ....[t] he movement of molten iron in the core creates electric currents, and electric currents create a magnetic field. So every change in the flow of the core means changes in the magnetic field...."
Credits & References:
- European Space Agency (2014, June 19) Swarm Reveals Earth’s Changing Magnetism. Accessed September 5, 2014.
- NASA Earth Observatory (2011, April 23) Earth’s Magnetosphere.
- NASA Earth Observatory (2004, May 22) Earth’s Surface Magnetism.
- NASA Earth Observatory (2004, March 30) Gravity Recovery and Climate Experiment.
Images and video courtesy of European Space Agency/Technical University of Denmark (ESA/DTU Space). Caption by Mike Carlowicz, based in part on a story from the European Space Agency.
Labels:
European Space Agency,
Geo-Video,
magnetic field,
NASA,
SWARM
Thursday, August 21, 2014
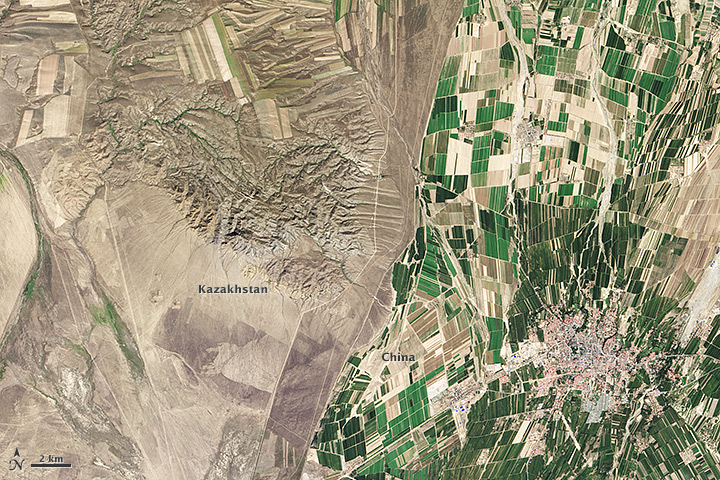
Cool Geo-Pic: Border Result of Different Agricultural Use
Found the cool geo-pic from the familiar NASA Earth Observatory. Fascinating how the different demands & policies for agricultural land use can produce such a stark contrast.
Geo-Pic:

Quick "Cut & Paste" Description:
"....The border between the two countries is defined by land-use policies. In China, land use is intense. Only 11.62 percent of China’s land is arable. Pressed by a need to produce food for 1.3 billion people, China farms just about any land that can be sustained for agriculture. Fields are dark green in contrast to the surrounding arid landscape, a sign that the agriculture is irrigated. As of 2006, about 65 percent of China’s fresh water was used for agriculture, irrigating 629,000 square kilometers (243,000 square miles) of farmland, an area slightly smaller than the state of Texas....."
".....The story is quite different in Kazakhstan. Here, large industrial-sized farms dominate, an artifact of Soviet-era agriculture. While agriculture is an important sector in the Kazakh economy, eastern Kazakhstan is a minor growing area. Only 0.03 percent of Kazakhstan’s land is devoted to permanent agriculture, with 20,660 square kilometers being irrigated....."
Credits: Source link
Geo-Pic:

Quick "Cut & Paste" Description:
"....The border between the two countries is defined by land-use policies. In China, land use is intense. Only 11.62 percent of China’s land is arable. Pressed by a need to produce food for 1.3 billion people, China farms just about any land that can be sustained for agriculture. Fields are dark green in contrast to the surrounding arid landscape, a sign that the agriculture is irrigated. As of 2006, about 65 percent of China’s fresh water was used for agriculture, irrigating 629,000 square kilometers (243,000 square miles) of farmland, an area slightly smaller than the state of Texas....."
".....The story is quite different in Kazakhstan. Here, large industrial-sized farms dominate, an artifact of Soviet-era agriculture. While agriculture is an important sector in the Kazakh economy, eastern Kazakhstan is a minor growing area. Only 0.03 percent of Kazakhstan’s land is devoted to permanent agriculture, with 20,660 square kilometers being irrigated....."
Credits: Source link
- BBC News (2010, January 30) Kazakhs protest against China farmland lease. Accessed July 9, 2014.
- Earth Observatory (2013, September 25) Fall harvest in Kazakhstan. Accessed July 9, 2014.
- Encyclopedia of Earth (2013, August 25) Land use profile of China. Accessed July 9, 2014.
- Fragile Oasis (2011, September 7) Borders from space. Accessed July 9, 2014.
- United States Central Intelligence Agency (2014, June 22) The world factbook: China. Accessed July 9, 2014.
- United States Central Intelligence Agency (2014, June 22) The world factbook: Kazakhstan. Accessed July 9, 2014.
NASA Earth Observatory image by Robert Simmon, using Landsat data from the U.S. Geological Survey. Caption by Holli Riebeek.
- Instrument(s): Landsat 8 - OLI
Labels:
agriculture,
china,
Geo-Pic,
Kazakhstan,
Landsat,
NASA
Subscribe to:
Posts (Atom)

