Esri News Feed

Sunday, September 27, 2009

Cool Geo-Vid: Moon Crashing


I had to come up with a new term for this one: "Geo-Vid". Taken from video footage of Japan's
KAGUYA spacecraft (care of JAXA), this "fly by crash" just looks too serene to be real.


First brought to my attention by NASA's Astronomy Picture of the Day , below are the "Cut & Paste" Highlights:


".... Japan's Kaguya spacecraft crashed into the Moon [June 2009], as planned. Officially named the Selenological and Engineering Explorer (SELENE), the spacecraft was given the nickname Kaguya after the princess in the Japanese folklore story The Tale of the Bamboo Cutter. Pictured above is a movie taken by Kaguya during the last orbit of its twenty-month lunar mission. A desolate, hilly, and cratered terrain passes underneath as the spacecraft barely clears a few peaks. At the movie's end, the spacecraft disappears into darkness near Gill crater. Robotic SELENE carried thirteen scientific instruments and two HDTV cameras. The groundbreaking mission took data on lunar topology and composition that are being used to better understand the origin and history of Earth's unique and ancient companion. Data and images from and the recently launched Lunar Reconnaissance Orbiter could be used to choose good locations to land future Moon-exploring astronauts...."

Full Credits:

NASA's Astronomy Picture of the Day
JAXA's
Kaguya Lunar Project

Friday, September 25, 2009

Mapping "Madoff Crime"- Victim Density for Florida & New York


These snapshots came from the Madoff Victim Map List of Madoff Clients wesite at www.MadoffMap.com I chose two locations, downtown New York and South Florida as examples.


Taken from the Site - "Cut & Paste" Highlights:
"... Each client's location is mapped with an icon showing the density of nearby Madoff clients. The icon colors range from green to red creating a heat map effect across the United States. The density of Madoff clients is greatest in Florida, New York and California. ..."


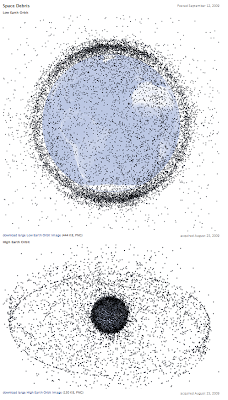
Cool Geo-Pic: Space Debris

This Cool Geo-Pic comes again from NASA's Earth Observatory. At first this is a very startling image of "trash in space". Luckily the dots are not to scale, and can be compared to other exaggerations of "blackening the sky...".

Quick "Cut & Paste" Highlights:

" ... Orbital debris, or “space junk,” is any man-made object in orbit around the Earth that no longer serves a useful purpose. Space junk can be bad news for an orbiting satellite.
The dots between the geostationary orbit and the low-Earth orbit are in an orbit used by GPS satellites or a highly elliptical orbit, called Molniya, used to monitor the far north or south. To read more about common satellite orbits, see
Catalog of Earth Satellite Orbits on the Earth Observatory...."

"....Though the black dots that represent objects in space swarm around the Earth, obscuring the surface in the lower image, the space junk situation is not as dire as it may appear. The dots are not to scale, and space is a very big place. Collisions between large objects are fairly rare...."


download large Low Earth Orbit image (444 KB, PNG) acquired August 25, 2009

Full Article - Click Here


References / Credits:
NASA Orbital Debris Program Office. (2009, July). Orbital debris frequently asked questions. Accessed September 11, 2009.

NASA illustration courtesy Orbital Debris Program Office. Caption by Holli Riebeek.

Instrument:
Model

Tuesday, September 22, 2009

Cool Geo-Pic: North Pole Sea Ice Minimum 2009

This Cool Geo-Pic comes again from NASA's Earth Observatory. Part of larger series on measuring the loss of one million square miles of polar ice in the Arctic Ocean, it highlights the pace of the ice loss.

Nothing about this is "new to the planet" except for THE RATE OF CHANGE.

Fluctuations in sea level (30 meters lower as recent as 20,000 years ago) - once measured in centuries and millennia are now occurring over decades.


Quick "Cut & Paste" Highlights:

" ... On September 12, 2009, sea ice in the Arctic Ocean most likely reached its minimum extent for 2009, said the National Snow and Ice Data Center. The reach of Arctic sea ice fluctuates through the year, growing in the winter and shrinking through the summer...."

"....This image illustrates the 2009 minimum on September 12, when ice covered 5.10 million square kilometers (2.97 million square miles) of the Arctic Ocean. The average minimum between 1979 and 2000, outlined in yellow, was 6.71 million square kilometers...."

"....The graph illustrates the difference between 2009, 2008, and 2007 sea ice extent and the average extent. Sea ice covered a smaller area in 2009 compared to 2008 until August, at which point ice loss in 2008 surpassed 2009. Neither year came close to 2007, which was low from the start of the melt season. All years were significantly below average...."

"....To see how sea ice has changed since 2000, see the Earth Observatory’s World of Change entry on
Arctic Sea Ice...."


Full Article - Click Here


References / Credits:

National Snow and Ice Data Center. (2009, September 17).
Arctic sea ice reaches annual minimum extent. Accessed September 18, 2009.

Scott, M. (2009, April 20).
Sea Ice. NASA’s Earth Observatory. Accessed September 18, 2009.

NASA images created by Jesse Allen and Rob Simmon, using AMSR-E sea ice concentration data provided courtesy of the
National Snow and Ice Data Center. Caption by Holli Riebeek.

Instrument:
Aqua - AMSR-E

Monday, September 21, 2009

Cool Geo-Pic - Fires in Los Angeles County


This Cool Geo-Pic comes again from NASA's Earth Observatory. I particularly liked how the image reveals the difficult canyon terrain that challenged fire fighting efforts.

Quick "Cut & Paste" Highlights:

" ... Two weeks after an arsonist ignited the drought-dry forest north of Los Angeles, the Station fire had become the ninth largest fire in California since 1933...."

" .... On the morning of September 8, 2009, the fire had burned more than 250 square miles (about 650 square kilometers) of land, according to the
Station Fire Incident Report from September 8.... "

" ....This image, captured by the Advanced Spaceborne Thermal Emission and Reflection Radiometer (
ASTER) on NASA’s Terra satellite on September 6, shows the extent of the burned area. ...."


" .... The burned area covers much of the San Gabriel Mountains, edging down into residential areas northwest of Pasadena .... The image also illustrates why fighting the Station fire has been so difficult. The fire burned over steep mountains riddled with canyons. The rugged landscape looks wrinkled, particularly in the burned area where plants no longer soften the ridgelines and canyons .... "

Full Article - Click Here

References / Credits:


Bloomekatz, A.B. (2009, September 6). Station fire, among state’s top 10, moves toward Littlerock, Juniper Hills. Los Angeles Times. Accessed September 8, 2009.

InciWeb. (2009, September 8).
Station Fire. Accessed September 8, 2009.

Mount Wilson Observatory. Accessed September 8, 2009.

More images of this event in Natural Hazards

NASA image created by Jesse Allen, using data provided courtesy of NASA/GSFC/METI/ERSDAC/JAROS, and U.S./Japan ASTER Science Team. Caption by Holli Riebeek.

Instrument:
Terra - ASTER

Cool Geo-Pic: Hurricane Jimena by Visual & Radar

This Cool Geo-Pic comes again from NASA's Earth Observatory.

What I like most about the image is the "satellite to radar" comparison. I can happily report "all has been quiet" on the hurricane front for us Floridians.


Quick "Cut & Paste" Highlights:

" ... The center of Hurricane Jimena was coming ashore over Baja California on September 2, 2009, when these images were taken. The top image is from the Moderate Resolution Imaging Spectroradiometer (
MODIS) on NASA’s Aqua satellite. The lower image was made from data collected by a radar instrument flying on the Cloudsat satellite. Together, the images show the structure of the Category 1 hurricane shortly after it make landfall. The storm brought both damaging wind and drought-breaking rain to the peninsula...."


Full Article - Click Here


download large image (32 KB, PNG) acquired September 2, 2009


References / Credits:


National Hurricane Center. (2009, September 4). Hurricane Jimena Advisory Archive. National Oceanic and Atmospheric Administration, National Weather Service. Accessed September 4, 2009.

Stevenson, M. (2009, September 3).
Jimena weakening after plowing into Mexico. Associated Press. Accessed September 4, 2009.

More images of this event in Natural Hazards

NASA image created by Jesse Allen, using CloudSat FirstLook data provided courtesy of the CloudSat team at Colorado State University.

Instrument:
CloudSat - CPR

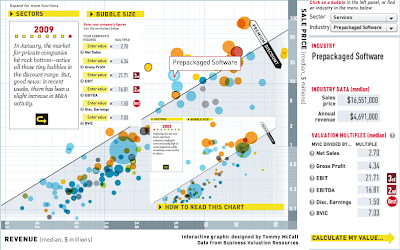
Valuing a Vertical Industry Over Time - a Visual Perspective


Taken from Inc and first brought to my attention from FlowingData

the interactive site allows a measure of business evaluation by vertical industry.

For my collage example, I examined Prepackaged Software and changes in valuation from 2002 to 2009. Its allows for you enter your own company's valuation figures; enter your Net Sales, Gross Profit, EBIT/EBITA, Earnings & BVIC to obtain your valuation score.


From the Business Buyer's Guide:

" .... For the sixth year, Inc. has partnered with Business Valuation Resources to produce our guide to valuing your business. The graphics, tables, and work sheets that make up this guide -- which are based on 2,168 transactions from January 1, 2007, to March 31, 2009, in 122 industries -- can help you get a sense of what has happened to your business's worth in this economy...."


Full Credits on Interactive graphic designed by Tommy McCall & Data from Business Valuation Resources

Tuesday, September 15, 2009

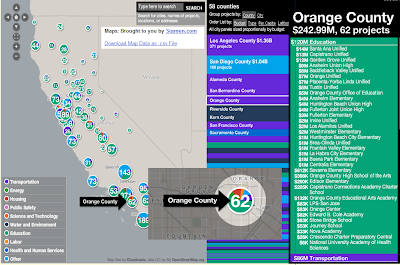
California Stimulus: Interactive Mapping of Spend

Taken from the California Economic Recovery Portal, a brilliant interactive display of stimulus spend throughout the state of California. My image collage highlights Orange County.

Full Credits to Stamen.com and Flowing Data for bringing this to "life & attention". MapTiles by CloudMade and data CC by SA OpenStreetMap.org