Esri News Feed

Thursday, July 17, 2008

Save My Airport!


________________________________________________________________________

The Business Travel Coalition has created a website, Save My Airport!, that’s intended to spotlight the risk to smaller markets and presumably to stir up civic opposition to the cuts. _______________________________________________________________________________________________________
At this website, BTC has put together a list of 50 larger airports at risk of having service sharply curtailed and 100 smaller airports that could even see service eliminated completely.

Top 50 Large City Airports at Risk


Top 100 Regional Airports at Risk

Wednesday, July 16, 2008

Cool Geo-Pic: Formation and Decay of Hurricane Bertha


Another Cool Geo-Pic from NASA's Earth Observatory.
now living in Florida nearly sixteen years, you appreciate the power of the massive storms with your livelihood in mind.

Large images
July 4, 2008 (238 kB JPEG)
July 7, 2008 (212 kB JPEG)
July 9, 2008 (181 kB JPEG)
July 13, 2008 (136 kB JPEG)

Cut & Paste" Highlights:
"... This series of images chronicles the development and decay of the first hurricane of the 2008 Atlantic hurricane season, Hurricane Bertha. The images were taken by the Tropical Rainfall Measuring Mission (TRMM) satellite, which uses microwave and radar sensors to see both the swirling clouds and bands of rain that define the structure of the storm...."

References:
National Hurricane Center.
Hurricane Bertha advisory archive. Accessed July 15, 2008.
Roberts, E. and McFadden, D. (2008, July 15).
Tropical Storm Bertha rakes Bermuda. Associated Press. Accessed July 15, 2008.
Images produced by Hal Pierce and caption by Steve Lang and Holli Riebeek.

Cool Geo-Pic: Dakar, Senegal


Another Cool Geo-Pic from NASA's Earth Observatory.

There is something striking about the coast edges that makes this image intriguing.


Click here to view full image (1352 kb)

"Cut & Paste Description" Highlights:
" ....In 2008, one out of every four people living in Senegal lived in the coastal capital of Dakar. Over previous decades, the city spread over the Cap Vert Peninsula as a result of both migration and growing families. In the 1940s, the city occupied just the southern tip of the peninsula. By the beginning of the twenty-first century, cityscape had sprawled both northward and eastward..... "

Click Here for Full Article


References:
United Nations Environment Programme. (2008).
Africa: Atlas of Our Changing Environment. Division of Early Warning and Assessment, United Nations Environment Programme, Nairobi, Kenya.
Hopkins, B. (2008).
Birding in the Dakar area. Seawatching in Senegal.
NASA image created by Jesse Allen, using Landsat data provided by the
United States Geological Survey. Caption by Michon Scott.

Cool Geo-Pic: Toshka Lakes, Egypt


Another cool geo-pic from NASA's Earth Observatory.
I like the idea of shift and drowning dunes.

"Cut & Paste" Highlights:
" ... In the late 1990s, Egypt’s new manmade
Toshka Lakes, fed from Lake Nasser via a canal, grew and spilled into new basins to become four major and two smaller lakes. These lakes extended 120 kilometers across the desert west of the Nile River in southern Egypt. Starting in 2002, astronauts have seen the lakes slowly decline, with the telltale ring of darker, moistened ground showing the previous higher water levels (see prior comparison of astronaut imagery of the lakes). The rise and fall of Toshka Lakes and the economic development surrounding the region are dependent on climate fluctuations and water agreements with upstream countries that, in turn, determine the long-term water flow in the lower Nile.

In the late 1990s, Egypt’s new manmade Toshka Lakes, fed from Lake Nasser via a canal, grew and spilled into new basins to become four major and two smaller lakes. These lakes extended 120 kilometers across the desert west of the Nile River in southern Egypt. Starting in 2002, astronauts have seen the lakes slowly decline, with the telltale ring of darker, moistened ground showing the previous higher water levels (see prior comparison of astronaut imagery of the lakes). The rise and fall of Toshka Lakes and the economic development surrounding the region are dependent on climate fluctuations and water agreements with upstream countries that, in turn, determine the long-term water flow in the lower Nile.... "

Cool Geo-Pic: Southern Ocean Carbon Sink

----------------------------------------------------------------------------------------------------------------------------------------------------------------------------------------------------------------------------------------------------------------------------------------------------------------------------------------------------------------------------------------------------------------------------------------------------------------------This is an interesting consequence of weather - low carbon absorbtion. As weather patterns may increase to extremes with global climate change - recalcs to absorbtion rates seem re need "rethinking".

Cut & Paste Highlights:

" ... As people have put more and more carbon dioxide into the atmosphere, the ocean has responded by soaking up more carbon dioxide—a trend scientists expected to continue for many years. But in 2007, a team of scientists reported in the journal Science that between 1981 and 2004 carbon dioxide concentrations in the Southern Ocean didn’t change at all, even though global atmospheric levels continued to rise. This graph shows the changes scientists expected to see (blue line) compared to their estimate of actual carbon dioxide absorption (red line). The results suggested that the Southern Ocean was no longer keeping pace with human carbon dioxide emissions."

Wednesday, July 09, 2008

Data Display - Change in Airline Service


  • This interactive map is a great mix of two of my passions; the intelligent display of complex data and air travel.
Full credits to USA Today, asn William Coauch, Barbara Hansen and Anne Carey who put this together.

Monday, July 07, 2008

Cool GeoPic: Recent Ocean Level Change


Well, so now we know where is started....

Cut & Paste Highlights:

" ... Unlike the water in a sink or a bathtub, the water level in Earth’s oceans is not the same everywhere; sea level varies with location and time. On time spans of hours to days, sea level is influenced by tides, winds, and waves, including storm surges. Sea level rises when oceans warm, and it drops when they cool (because water expands when it heats up and contracts when it cools). Regional variations in sea level can persist for many years, even a decade. Underlying all these changes is the slower rise and fall in global average sea level as ice ages recede and advance over millenia.


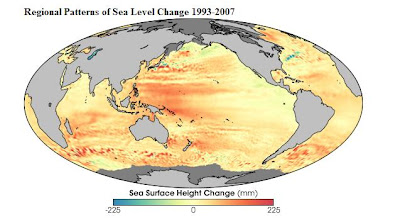
This map shows global patterns of changes in sea level (sea surface height) measured by satellite-based altimeters (Topex and Jason 1 satellites) from 1993 through the end of 2007. Places where the sea surface height increased up to 225 millimeters (about 8.9 inches) are shown in dark red; places where sea level dropped are blue. The most widespread change in sea level over this time period was an increase in the Western Pacific sea surface height. During the period spanned by this image, a climate pattern called the Pacific Decadal Oscillation was in its warm phase, and sea surface temperatures were above average in much of the basin. Thermal expansion during this warm phase would be consistent with a rise in sea level...."

Full Article:

http://earthobservatory.nasa.gov/Newsroom/NewImages/images.php3?img_id=18075

Cool Geo Pic: Where do these images come from?


This one wins for "where the Next Cool Geo-Pics will come from" award.


Click here to view full image (360 kb)

Cut & Paste Highlights:
" When we hear the word topography, most of us think of mountains and valleys on dry land. But the surface of the ocean has topography, too, and the variation in the height of the sea surface from place to place reveals important information about weather, climate, and rising sea level. On June 20, 2008, NASA launched the Ocean Surface Topography Mission (OSTM)/Jason 2 satellite, the latest in a series of U.S./French satellites to collect observations of ocean surface height...."

Full Article:

http://earthobservatory.nasa.gov/Newsroom/NewImages/images.php3?img_id=18069

Cool Geo-Pic: Heat Wave in Northern Europe


Europe goes global warming ... perhaps. I believe the science, but this snapshot is more intriguing than conclusive. As always, watch this space.

Cut & Paste Highlights:
On the calendar, Scandinavian summer starts on June 21 in 2008, but summer temperatures had already settled over much of northern Europe by early June..... The image compares the average temperature between June 2 and June 8, 2008, to average temperatures recorded during the same period in June 2000 through 2007. Areas that were warmer than average are red, while cooler than average conditions are represented in blue.The heat that dominated the weather in northern Europe in early June is evident in the dark red that covers Norway, Sweden, Denmark, and parts of Germany and Poland. Southern Europe experienced cooler than average temperatures during the period.... "
Full Article: