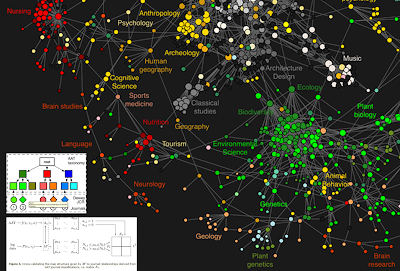
Full credits to the authors below, and brought to my attention by DirectionsMag.com - a fascinating visual diagram of scientific inter-relations by citation reference.
Quick "Cut & Paste" Highlights:
" ...Methodology:
Over the course of 2007 and 2008, [they] collected nearly 1 billion user interactions recorded by the scholarly web portals of some of the most significant publishers, aggregators and institutional consortia. The resulting reference data set covers a significant part of world-wide use of scholarly web portals in 2006, and provides a balanced coverage of the humanities, social sciences, and natural sciences. A journal clickstream model, i.e. a first-order Markov chain, was extracted from the sequences of user interactions in the logs. .... The resulting model was visualized as a journal network that outlines the relationships between various scientific domains and clarifies the connection of the social sciences and humanities to the natural sciences...."
References / Credits:
Johan Bollen1*, Herbert Van de Sompel1, Aric Hagberg2#, Luis Bettencourt2,3#, Ryan Chute1#, Marko A. Rodriguez2, Lyudmila Balakireva1
1 Digital Library Research and Prototyping Team, Research Library, Los Alamos National Laboratory, Los Alamos, New Mexico, United States of America, 2 Theoretical Division, Mathematical Modeling and Analysis Group, and Center for Nonlinear Studies, Los Alamos National Laboratory, Los Alamos, New Mexico, United States of America, 3 Santa Fe Institute, Santa Fe, New Mexico, United States of America
1 Digital Library Research and Prototyping Team, Research Library, Los Alamos National Laboratory, Los Alamos, New Mexico, United States of America, 2 Theoretical Division, Mathematical Modeling and Analysis Group, and Center for Nonlinear Studies, Los Alamos National Laboratory, Los Alamos, New Mexico, United States of America, 3 Santa Fe Institute, Santa Fe, New Mexico, United States of America
Citation: Bollen J, Van de Sompel H, Hagberg A, Bettencourt L, Chute R, et al. (2009) Clickstream Data Yields High-Resolution Maps of Science. PLoS ONE 4(3): e4803. doi:10.1371/journal.pone.0004803
Editor: Alan Ruttenberg, Science Commons, United States of America
Received: June 25, 2008; Accepted: February 6, 2009; Published: March 11, 2009
This is an open-access article distributed under the terms of the Creative Commons Public Domain declaration which stipulates that, once placed in the public domain, this work may be freely reproduced, distributed, transmitted, modified, built upon, or otherwise used by anyone for any lawful purpose.
This is an open-access article distributed under the terms of the Creative Commons Public Domain declaration which stipulates that, once placed in the public domain, this work may be freely reproduced, distributed, transmitted, modified, built upon, or otherwise used by anyone for any lawful purpose.
Funding: This research was funded as part of the MESUR project (http://www.mesur.org/) by the Andrew W. Mellon Foundation. The funders had no role in study design, data collection and analysis, decision to publish, or preparation of the manuscript.
Competing interests: The authors have declared that no competing interests exist.
No comments:
Post a Comment