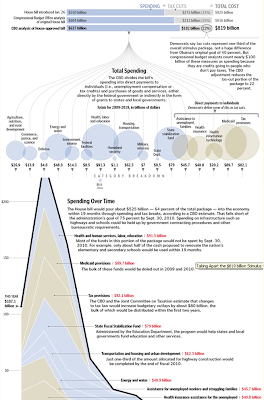
As I continued to research, I came across another more detailed visual portrayal of the economic stimulus plan.
This one has a better temporal dynamic on the axis showing the impact over time from fiscal year 2009 thru 2019.
In particular, the large numbers from Medicaid provisions, state fiscal stabilization and health insurance for the unemployed are now "top of mind" political topics in their own right.
No comments:
Post a Comment