Wednesday, March 24, 2010
SRC Becomes Alteryx®, LLC

The Alteryx brand has emerged as a leader in the current spatial business intelligence revolution. SRC, LLC has changed its company name to Alteryx, LLC; the product brand introduced in 1997 has become the strongest standalone Geographic Business Intelligence® software platform in the world today.
The Alteryx technology has matured into the first integrated business intelligence platform that delivers a comprehensive set of software, data and services serving local, regional and global markets. “Within our user base, the Alteryx name already identifies our company, and is well known within the international developer community as the trusted leader in streamlining disparate data sources into enterprise workflows,” said Dean Stoecker, Alteryx, LLC CEO and president. “Taking on the Alteryx brand as our company name is a natural evolution of our business, and represents an industry milestone in embedding spatial data into all levels of business logic. We are extending Geographic Business Intelligence to better business strategies and operational decision-making taking place every day across industry, government and academic disciplines.”
Read more


Friday, March 19, 2010
Sunday, February 28, 2010
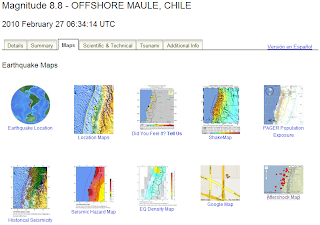
Mapping Earthquakes & Tsunamis: Chile's recent magnitude 8.8 quake
For visual representations of the earthquake and resulting tsunami, here are two great government sources; USGS & NOAA.
From USGS, the have a detailed site (image below):
For NOAA, here are a few quick map highlights of the resulting tsunami.
Energy Forecast in wave height:


" The Richter magnitude scale, also known as the local magnitude (ML) scale, assigns a single number to quantify the amount of seismic energy released by an earthquake. .... So, for example, an earthquake that measures 5.0 on the Richter scale has a shaking amplitude 10 times larger than one that measures 4.0. The effective limit of measurement for local magnitude ML is about 6.8...."
From USGS, the have a detailed site (image below):
For NOAA, here are a few quick map highlights of the resulting tsunami.
Energy Forecast in wave height:

Timetracker of wave position:

" The Richter magnitude scale, also known as the local magnitude (ML) scale, assigns a single number to quantify the amount of seismic energy released by an earthquake. .... So, for example, an earthquake that measures 5.0 on the Richter scale has a shaking amplitude 10 times larger than one that measures 4.0. The effective limit of measurement for local magnitude ML is about 6.8...."
Mapping for the Gold - Olympics Style:Vancouver’s Olympic Venues

My family & I have really enjoyed this year's Olympic saga. Having some co-workers from Vancouver and parts of Canada added "a nice flair" to watching the events. My favorites - skeleton, short track & anything freestyle. Seemed appropriate to give the Olympics its credit with a map related post. This was first posted online at the NY Times site.
Credits:
Interactive map from the NY Times by SHAN CARTER, MATTHEW ERICSON and JOE WARD; Additional reporting by Melissa Hoppert .
Sources: Elevation data by Intermap Technologies Inc.; satellite photographs by DigitalGlobe, Province of British Columbia and TerraMetrics via Google Earth
A perspective on scale - from point to universe
I like this a short film "The Known Universe" from the American Museum of Natural History, “shows the known universe as mapped through astronomical observations....”. We begin from a point on earth, in this case the Himalayan Mountain range, and then rapidly "expand outwards". This portion of the movie where it shows the “fields of mapped space” intrigued me, particularly the astronomical swath of obscured vision that is "uncharted space". This puts you "in your place" a bit, but is still a rewarding perspective.
Monday, February 15, 2010

Monday, February 08, 2010
Sinam's Favorite Super Bowl ad - Simpson's Coke "Sell Out"
This was an easy choice, as my allegiance to Coca Cola is literally "tattooed" on my ribs - and I've been a Simpson fan for decades. Tame by most measures, and a shameless "sell-out" - but suitable to the "my generation" they are targeting.
Wal-Mart Tightens Delivery Deadlines
Wal-Mart Tightens Delivery Deadlines
Article on balancing Wal-Mart vendor requirements for supply chain inventory mgmt & just in time delivery.
Posted using ShareThis
Article on balancing Wal-Mart vendor requirements for supply chain inventory mgmt & just in time delivery.
Posted using ShareThis
Thursday, January 28, 2010
GeoSinam - Wordle Colliage

Thursday, January 14, 2010
Cool Geo-Pic: Currents Collide and Coastal Waters Bloom off Patagonia
This Cool Geo-Pic comes again from NASA's Earth Observatory. I love the nutrient patterns based on the blooms from change ocean currents. The pathways from my fridge to the couch are much less interesting ....

Quick "Cut & Paste" Highlights:
" ...Located over the continental shelf of southeastern South America is one of the world’s most productive and complex marine ecosystems. Covering about 1.2 million square kilometers (4.6 million square miles) of coastal waters, the Patagonia Large Marine Ecosystem stretches from the Rio de le Plata (a wide estuary at the mouth of the Paraná River) to the southern tip of the continent...."
"... In November 2009, as summer approached in the Southern Hemisphere, the foundation of the ecosystem’s food web—plant-like microorganisms called phytoplankton—bloomed expansively, brightening the waters with living ribbons of color...."
"....The sea surface temperature image (right) reveals one of the reasons for the region’s productivity: the convergence of two wind-driven ocean currents. The warm, salty Brazil Current meanders south over the continental shelf, where it meets the cold, less-salty Falklands/Malvinas Current, a north-flowing branch off the Antarctic Circumpolar Current...."
"....In the spring and summer, the convergence zone occurs at about the latitude of the Rio de la Plata, which is where it seems to be based on the water temperatures shown in the sea surface temperature image. Blues and purples (cooler water) dominate the image south of the estuary, while pinks and yellows (warmer water) dominate the image north of there...."
Full Article - Click Here
References / Credits:
These images are made from data collected by the Moderate Resolution Imaging Spectroradiometer (MODIS) on NASA’s Aqua satellite in November 2009. Aqua has been collecting data on the ecological and physical state of the ocean since its launch in 2002. Monthly maps of chlorophyll and sea surface temperature from Aqua are available in Global Maps on the Earth Observatory.
NASA Earth Observatory images created by Jesse Allen, using data provided courtesy of the Ocean Color Group team at NASA’s Goddard Space Flight Center. Caption by Rebecca Lindsey.
Instrument:
Aqua - MODIS

Quick "Cut & Paste" Highlights:
" ...Located over the continental shelf of southeastern South America is one of the world’s most productive and complex marine ecosystems. Covering about 1.2 million square kilometers (4.6 million square miles) of coastal waters, the Patagonia Large Marine Ecosystem stretches from the Rio de le Plata (a wide estuary at the mouth of the Paraná River) to the southern tip of the continent...."
"... In November 2009, as summer approached in the Southern Hemisphere, the foundation of the ecosystem’s food web—plant-like microorganisms called phytoplankton—bloomed expansively, brightening the waters with living ribbons of color...."
"....The sea surface temperature image (right) reveals one of the reasons for the region’s productivity: the convergence of two wind-driven ocean currents. The warm, salty Brazil Current meanders south over the continental shelf, where it meets the cold, less-salty Falklands/Malvinas Current, a north-flowing branch off the Antarctic Circumpolar Current...."
"....In the spring and summer, the convergence zone occurs at about the latitude of the Rio de la Plata, which is where it seems to be based on the water temperatures shown in the sea surface temperature image. Blues and purples (cooler water) dominate the image south of the estuary, while pinks and yellows (warmer water) dominate the image north of there...."
Full Article - Click Here
References / Credits:
These images are made from data collected by the Moderate Resolution Imaging Spectroradiometer (MODIS) on NASA’s Aqua satellite in November 2009. Aqua has been collecting data on the ecological and physical state of the ocean since its launch in 2002. Monthly maps of chlorophyll and sea surface temperature from Aqua are available in Global Maps on the Earth Observatory.
NASA Earth Observatory images created by Jesse Allen, using data provided courtesy of the Ocean Color Group team at NASA’s Goddard Space Flight Center. Caption by Rebecca Lindsey.
Instrument:
Aqua - MODIS
Subscribe to:
Posts (Atom)