The Stunning Early Infographics and Maps of the 1800s http://flip.it/Oo.V5P
Showing posts with label maps. Show all posts
Showing posts with label maps. Show all posts
Tuesday, January 31, 2017
Tuesday, January 24, 2017
Mapping Touch: A Tactile Atlas Helps the Blind 'See' Maps
A Tactile Atlas Helps the Blind 'See' Maps http://flip.it/Ncc0eG
Tuesday, January 10, 2017
Friday, December 16, 2016
Mapping Intelligence- looking at past conflict area depictions
Captivating CIA maps give an insight into eight decades of top-secret intelligence
http://flip.it/QBzeEv
Monday, December 12, 2016
Mapping gifts - What I want for Christmas
10 Great Gifts for Map Lovers and Travelers
http://flip.it/QJe_n-
Tuesday, February 14, 2012
Mapping Valentine's Day - Bonne's Projection

Happy Valentine's Day - link to Bonne's Projection.
From Wikipedia:
A Bonne projection is a pseudoconical equal-area map projection, sometimes called a dépôt de la guerre or a Sylvanus projection. Although named after Rigobert Bonne (1727–1795), the projection was in use prior to his birth, in 1511 by Sylvano, Honter in 1561, De l'Isle before 1700 and Coronelli in 1696[1].
The projection is:


Parallels of latitude are concentric circular arcs, and the scale is true along these arcs. On the central meridian and the standard latitude shapes are not distorted.
Special cases of the Bonne projection include the sinusoidal projection, when φ1 is zero, and the Werner projection, when φ1 is π/2. The Bonne projection can be seen as an intermediate projection in the unwinding of a Werner projection into a Sinusoidal projection; an alternative intermediate would be a Bottomley projection[3]
Wednesday, June 29, 2011
Anthropomorphic and zoomorphic maps - When Depictions of Life intersects Location
Neat blog post on Anthropomorphic and zoomorphic maps. Credits to The Map Room and Donna Seger's The Streets of Salem of bringing this to my attention.
From her post " ... The shift from conceptual to more realistic cartography in the early modern era is a very evident and important trend, but early modern mapmakers retained a bit of whimsy when they produced maps in the form of plants, animals and humans in the sixteenth and seventeenth centuries...."

Specific to this image, " ...Another lively early modern map is the “Dutch Lion” map (Leo Belgicus, Leo Hollandicus ) issued in a succession of variations from the late sixteenth century, contemporaneously with the Dutch Revolt against Spain. The rebellious Dutch provinces are shown in the form of a lion, roaring in the face of the powerful Spanish Empire...."

From her post " ... The shift from conceptual to more realistic cartography in the early modern era is a very evident and important trend, but early modern mapmakers retained a bit of whimsy when they produced maps in the form of plants, animals and humans in the sixteenth and seventeenth centuries...."
German theology professor Heinrich Bunting’s Travels according to the Scriptures (1581):

Specific to this image, " ...Another lively early modern map is the “Dutch Lion” map (Leo Belgicus, Leo Hollandicus ) issued in a succession of variations from the late sixteenth century, contemporaneously with the Dutch Revolt against Spain. The rebellious Dutch provinces are shown in the form of a lion, roaring in the face of the powerful Spanish Empire...."
"Leo Hollandicus", JC Visscher, 1648

Friday, March 04, 2011
Mapping Android Usage - Activations by Continent
Interesting given all the recent press around "Apple-nation" - never count "the 'Droid" out.
Still no GSM for Apple iPhone on Verizon (aarrgghh).
Credits to FlowingData for bringing this to my attention.
Still no GSM for Apple iPhone on Verizon (aarrgghh).
Credits to FlowingData for bringing this to my attention.
Thursday, November 18, 2010
Lessons in Historical Geography - mapping border changes over time
For those interested in the changing national boundaries of Europe for the last ten thousand years or so - but only have 5 minutes to review, here's a You Tube for that!
Credits to Historical Atlas and there Centennia software for putting this together.
Credits to Historical Atlas and there Centennia software for putting this together.
Sunday, October 10, 2010
Mapping Taxi Rates - How much for a cab in Athens, Greece?
My wife is flying to Athens, Greece for work. During the layover she wanted to get some sightseeing in. This Taxi Cost Calculator site was useful.


I like the map options, and the right-click for "to and from" routing. I would love to see a better search for "sites of interest".


Thursday, September 30, 2010
Mapping the Casualties of War - Battlefield to US Hometown
This is sobering interactive display of war casualties, linking battlefield locations to hometowns. Credit to Flowing Data for bringing this to my attention - a collaboration between CNN and Stamen Design.


Tuesday, August 03, 2010
The Geo-Spatial Revolution Project: How "geo" is changing our world - from Penn State
Had to post this one. My under-grad was from Penn State in broadcasting and my Masters of Science & career work in geo-spatial. Interesting series on the importance of geo-spatial - a new series the folks at Penn State Public Broadcasting.
Tuesday, May 18, 2010
Mapping Oil Slicks - NY Times interactive visualization of the Gulf oil spill plume
Quick "Cut and Paste" highlights:
" ...The “probable extent” of the oil slick is an estimate by the National Oceanic and Atmospheric Administration of where oil is mostly likely to go based on wind and ocean current forecasts, as well as analysis of aerial photography and satellite imagery. The “observed extent” show areas where oil was visible on the surface of the water during aerial surveys of the Gulf. The observed extents are not available every day. The extents may vary widely from day to day because of changes in wind patterns and ocean currents...."
For more on the estimates, see this article.
Map Credits:
By ERIN AIGNER, JOE BURGESS, SHAN CARTER, HAEYOUN PARK and ARCHIE TSE
Sources: National Oceanic and Atmospheric Administration; U.S. Coast Guard; SkyTruth
Aritcle credits:
By JUSTIN GILLIS - Published: May 13, 2010
A version of this article appeared in print on May 14, 2010, on page A1 of the New York edition.
Bringing Dynamic Content to Aerial Imagery - GeoSemble video demo
While a somewhat dated demo, I found how geoSemble seemlessly overlaps vector and raster based map-data with dynamic news content - all tied to the commonality of geography - really fascinating stuff & worth the review.
Sunday, May 02, 2010
Mapping the Deepwater Horizon Incident, Gulf of Mexico
Given the wealth of information that is developing around this uncapped oil spill - I put together some NOAA and Twitter updates for review.
The latest report from NOAA:
Quick "Cut & Paste" from site:
" ... Oil continues to flow into the Gulf of Mexico at an estimated to 5000 barrels (210,000 gallons) per day from three leaks in damaged piping on the sea floor. The Unified Command decided to test a new technique to apply dispersants to oil at the source - 5000’ below the surface. Another test and follow-on analysis of the effects of dispersant and dispersed oil in the water column are necessary before the technique is operational, but if successful it could reduce or prevent an oil plume from forming at the surface...."


Some Additional Resources:
EPA: Federal Response to BP Spill in the Gulf of Mexico
This site tracks EPA's ongoing work in the area and help answer questions about the incident.
Deepwater Horizon Response on Facebook
This site is providing information regarding the April 20 incident in the US Gulf of Mexico involving a Transocean drilling Rig Deepwater Horizon.
On Twitter: Oil_Spill_2010
This site is providing information regarding the April 20 incident in the US Gulf of Mexico involving a Transocean drilling Rig Deep Water Horizon.
The latest report from NOAA:
Quick "Cut & Paste" from site:
" ... Oil continues to flow into the Gulf of Mexico at an estimated to 5000 barrels (210,000 gallons) per day from three leaks in damaged piping on the sea floor. The Unified Command decided to test a new technique to apply dispersants to oil at the source - 5000’ below the surface. Another test and follow-on analysis of the effects of dispersant and dispersed oil in the water column are necessary before the technique is operational, but if successful it could reduce or prevent an oil plume from forming at the surface...."

".... Preparation for drilling of a relief or cut-off well is underway - one drilling rig is on site and one should arrive this weekend, but the process will not be complete for several months. Work also continues on a piping system designed to take oil from a collection dome at the sea floor to tankers on the surface; this technique has never been tried at 5000’. High winds and seas curtailed surface skimming and application of dispersant by air today, but production of dispersant has ramped up to 70,000 barrels per day...."

"...Hundreds of thousands of feet of boom have been deployed to contain the spill, with hundreds of thousands more assigned. The Louisiana Department of Wildlife and Fisheries announced the closure of both recreational and commercial fishing in areas of likely impact and the Louisiana Department of Health and Hospitals closed molluscan shellfish (oyster) harvesting areas in the coastal parishes of Plaquemines and St. Bernard...."
Some Additional Resources:
EPA: Federal Response to BP Spill in the Gulf of Mexico
This site tracks EPA's ongoing work in the area and help answer questions about the incident.
Deepwater Horizon Response on Facebook
This site is providing information regarding the April 20 incident in the US Gulf of Mexico involving a Transocean drilling Rig Deepwater Horizon.
On Twitter: Oil_Spill_2010
This site is providing information regarding the April 20 incident in the US Gulf of Mexico involving a Transocean drilling Rig Deep Water Horizon.
Mapping Changes in Airspace - Volcanic Impact on European Air Traffic
I though this was a fascinating display of airspace and the recent Icelandic volcano's impact of European air traffic.
Airspace Rebooted from ItoWorld on Vimeo.
A quick "cut & paste" from the site:"... A visualisation of the northern European airspace returning to use after being closed due to volcanic ash. Due to varying ash density across Europe, the first flights can be seen in some areas on the 18th and by the 20th everywhere is open.
The flight data is courtesy of www.flightradar24.com and covers a large fraction of Europe. There are a few gaps (most noticeably France) and no coverage over the Atlantic, but the picture is still clear.
The map data is CC-by-SA www.openstreetmap.org and contributors.
This CC-by-SA visualisation was produced by www.itoworld.com with support from www.ideasintransit.org ..."
Friday, April 30, 2010
Funny Maps on a Friday: Redrawing Europe & finding Vulgaria
The Economist's "tongue-in-cheek" redrawing of geography of Europe, allowing for odd political alignments, the creation of mythical places, and other general map silliness.
I particularly like the justification for moving Poland and the other former Russian block nations, as they - having endured a 20th century history full of invasions, Communist occupation and everything else - "deserve some isolation" for a while.
Besides, who wouldn't want to "holiday" in a place like Vulgaria?
Enjoy the read.

Link to ful article here.
Friday, April 09, 2010
Map of Florida Area Roads and Traffic Growth
Florida Traffic Map - Map of Florida Area Roads and Traffic Growth
http://floridaroads.org/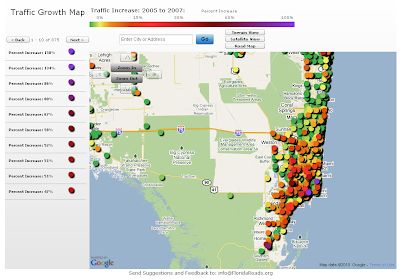
Found this site thru one of my GIS blog feeds. I would be curious to disect the data to look at differences in traffic congestion "off-season" and during the "snowbirds's arrival". The site allows for the standard "pan/zoom" or you and select by community/town of interest.
From the site:
"The Florida Traffic Growth Map highlights the busiest roads and highways. From 2005-2007, many roads and highways have seen at least a 50% increase in traffic. The map highlights the pace of change and increased utilization of Florida's infrastructure. In some areas the road conditions have changed significantly. The data is derived from the Florida Department of Transportation website. Each icon represents the location of a traffic counter and once clicked shows the annual average daily traffic (AADT) counts...."
http://floridaroads.org/

Found this site thru one of my GIS blog feeds. I would be curious to disect the data to look at differences in traffic congestion "off-season" and during the "snowbirds's arrival". The site allows for the standard "pan/zoom" or you and select by community/town of interest.
From the site:
"The Florida Traffic Growth Map highlights the busiest roads and highways. From 2005-2007, many roads and highways have seen at least a 50% increase in traffic. The map highlights the pace of change and increased utilization of Florida's infrastructure. In some areas the road conditions have changed significantly. The data is derived from the Florida Department of Transportation website. Each icon represents the location of a traffic counter and once clicked shows the annual average daily traffic (AADT) counts...."
Sunday, February 28, 2010
Mapping for the Gold - Olympics Style:Vancouver’s Olympic Venues

My family & I have really enjoyed this year's Olympic saga. Having some co-workers from Vancouver and parts of Canada added "a nice flair" to watching the events. My favorites - skeleton, short track & anything freestyle. Seemed appropriate to give the Olympics its credit with a map related post. This was first posted online at the NY Times site.
Credits:
Interactive map from the NY Times by SHAN CARTER, MATTHEW ERICSON and JOE WARD; Additional reporting by Melissa Hoppert .
Sources: Elevation data by Intermap Technologies Inc.; satellite photographs by DigitalGlobe, Province of British Columbia and TerraMetrics via Google Earth
A perspective on scale - from point to universe
I like this a short film "The Known Universe" from the American Museum of Natural History, “shows the known universe as mapped through astronomical observations....”. We begin from a point on earth, in this case the Himalayan Mountain range, and then rapidly "expand outwards". This portion of the movie where it shows the “fields of mapped space” intrigued me, particularly the astronomical swath of obscured vision that is "uncharted space". This puts you "in your place" a bit, but is still a rewarding perspective.
Subscribe to:
Posts (Atom)