I saw this on BBC and thought ..."Yup, that's a neat way to go into the Great Beyond".
Tuesday, May 12, 2009


Thursday, April 30, 2009
The World's Largest Populations Require Glacier Melt for Water Flow - a Map Display

This Cool Map comes from the UNEP/GRID Maps Library. What seems most telling, is that 3 billion+ people rely on glacier melt water flow for their basic water requirements. This is the most stark example I have have seen on the "inland" impact from climate change.
" ...Many of the largest rivers in the Himalayas Hindu Kush region are strongly dependent upon snow and glacial melt for waterflow. Many of the largest rivers in the Himalayas Hindu Kush region are strongly dependent upon snow and glacial melt for waterflow. Except for the fact that glaciers are melting rapidly in many places, we do not have adequate data to more accurately project when and where water scarcity will affect irrigation schemes in full. Making accurate projections is also difficult because of variations in the effects on ground and surface water, as well as on water for urban needs and industrial purposes Furthermore, the cost of water may also increase, seriously complicating the water scarcity question. Recent studies show that cost of water has increased by about 400–500% since 1990 in the Indo-Gangetic Basin of India..."
Full Article - Click Here
Download this graphic in png format, 1812 KB , suitable for web-sites, documents or presentations.

Download this graphic in tif format, 4501 KB, suitable for print and editing.
Download this graphic in jpg format, 1242 KB , suitable for web-sites, documents or presentations.

References / Credits:
(Source: Rees and Collins, 2004; UNEP, 2007).
Link to web-site http://www.grida.no/publications/rr/food-crisis/
Cartographer/Designer Ieva Rucevska, UNEP/GRID-Arendal
Appears in Environmental Food Crisis
Published 2009, Joel Benoit
Link to web-site http://www.grida.no/publications/rr/food-crisis/
Cartographer/Designer Ieva Rucevska, UNEP/GRID-Arendal
Appears in Environmental Food Crisis
Published 2009, Joel Benoit
Wednesday, April 29, 2009
Mapping Trends in Employment - a Visual Comparison by Year

This interactive map display pits the temporal display of thematic data; i.e. Mapping Trends in Employment - a Visual Comparison by Year.
Full credits to:
An interactive map of vanishing employment across the country. - By Chris Wilson - Slate Magazine.
An interactive map of vanishing employment across the country. - By Chris Wilson - Slate Magazine.
Tuesday, April 28, 2009
Cool Geo-Pic: Amount of Old Ice in Arctic Hits Record Low in February 2009

This Cool Geo-Pic comes again from NASA's Earth Observatory. While the loss of perennial sea ice opens trade routes, its seems a pale trade-off given the global impact of climate change, sea level rise and the more imaginative tales of polar shift.
Quick "Cut & Paste" Highlights:
" ...The summer minimum and the winter maximum are the two pivotal milestones in the annual cycle of Arctic sea ice. The thickness of sea ice and the extent at each of these times are key indicators of Arctic climate. Over the past two and a half decades, the extent of sea ice at the end of summer (mid-September) has declined significantly. The corollary to that trend is that at the winter maximum (end of February or mid-March), the ice covering the Arctic is much younger and thinner than it was in the past...."
"...The age of ice in the winter pack is important because young ice is thin and likely to melt in the upcoming summer. Historically, a large “core” of sea ice survived the summer. Around the margins of the perennial ice, new ice forms each winter and melts each summer. Ice that survives the summer melt thickens and hardens through freezing of new water and collisions with other ice floes, which builds thick ridges of ice....."
Full Article - Click Here
References / Credits:
Full Article - Click Here
References / Credits:
Maslanik, J., Fowler, C., Stroeve, J., Drobot, S., Zwally, J., Yi, D., and Emery, W. (2007). A younger, thinner Arctic ice cover: Increased potential for rapid, extensive sea-ice loss. Geophysical Research Letters, 34, L24501.
National Snow and Ice Data Center. Arctic Sea Ice News & Analysis. NSIDC Website. Accessed April 8, 2009.
Further Reading:
NASA satellites show Arctic literally on thin ice.
Dwindling Arctic Ice.
NASA images by Jesse Allen, based on data provided by James Maslanik and Chuck Fowler, University of Colorado and NSIDC. Caption by Rebecca Lindsey, with input provided by Walt Meier, NSIDC.
Instrument:
DMSP
NASA satellites show Arctic literally on thin ice.
Dwindling Arctic Ice.
NASA images by Jesse Allen, based on data provided by James Maslanik and Chuck Fowler, University of Colorado and NSIDC. Caption by Rebecca Lindsey, with input provided by Walt Meier, NSIDC.
Instrument:
DMSP
Saturday, April 18, 2009
LA vs. NY - the Geography of Buzz - Cultural Mapping

A great comparison display of the geography of media - first brought to my attention by Flowing Data - it continues the rivalry of two American centers of culture.
Quick "Cut & Paste" Highlights:
" ...Elizabeth Currid (USC) and Sarah Williams (Columbia University), collaborate to map the geography of buzz ..... mined thousands of photos from Getty Images which provided a dataset of parties in art, music, fashion, movies, film, etc and created density maps which in turn show the hip places to be...."
Full Article - Click Here
References / Credits: FlowingData RSS feed , NY Times
Connecting the Dots of Science - A Visual Structure of Scientific Activity by Citation Subject
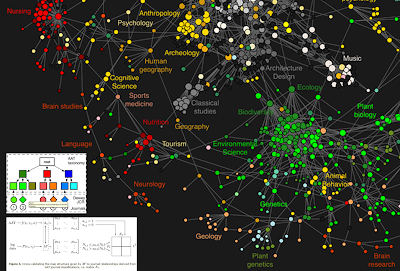
Full credits to the authors below, and brought to my attention by DirectionsMag.com - a fascinating visual diagram of scientific inter-relations by citation reference.
Quick "Cut & Paste" Highlights:
" ...Methodology:
Over the course of 2007 and 2008, [they] collected nearly 1 billion user interactions recorded by the scholarly web portals of some of the most significant publishers, aggregators and institutional consortia. The resulting reference data set covers a significant part of world-wide use of scholarly web portals in 2006, and provides a balanced coverage of the humanities, social sciences, and natural sciences. A journal clickstream model, i.e. a first-order Markov chain, was extracted from the sequences of user interactions in the logs. .... The resulting model was visualized as a journal network that outlines the relationships between various scientific domains and clarifies the connection of the social sciences and humanities to the natural sciences...."
" ...Methodology:
Over the course of 2007 and 2008, [they] collected nearly 1 billion user interactions recorded by the scholarly web portals of some of the most significant publishers, aggregators and institutional consortia. The resulting reference data set covers a significant part of world-wide use of scholarly web portals in 2006, and provides a balanced coverage of the humanities, social sciences, and natural sciences. A journal clickstream model, i.e. a first-order Markov chain, was extracted from the sequences of user interactions in the logs. .... The resulting model was visualized as a journal network that outlines the relationships between various scientific domains and clarifies the connection of the social sciences and humanities to the natural sciences...."
References / Credits:
Johan Bollen1*, Herbert Van de Sompel1, Aric Hagberg2#, Luis Bettencourt2,3#, Ryan Chute1#, Marko A. Rodriguez2, Lyudmila Balakireva1
1 Digital Library Research and Prototyping Team, Research Library, Los Alamos National Laboratory, Los Alamos, New Mexico, United States of America, 2 Theoretical Division, Mathematical Modeling and Analysis Group, and Center for Nonlinear Studies, Los Alamos National Laboratory, Los Alamos, New Mexico, United States of America, 3 Santa Fe Institute, Santa Fe, New Mexico, United States of America
1 Digital Library Research and Prototyping Team, Research Library, Los Alamos National Laboratory, Los Alamos, New Mexico, United States of America, 2 Theoretical Division, Mathematical Modeling and Analysis Group, and Center for Nonlinear Studies, Los Alamos National Laboratory, Los Alamos, New Mexico, United States of America, 3 Santa Fe Institute, Santa Fe, New Mexico, United States of America
Citation: Bollen J, Van de Sompel H, Hagberg A, Bettencourt L, Chute R, et al. (2009) Clickstream Data Yields High-Resolution Maps of Science. PLoS ONE 4(3): e4803. doi:10.1371/journal.pone.0004803
Editor: Alan Ruttenberg, Science Commons, United States of America
Received: June 25, 2008; Accepted: February 6, 2009; Published: March 11, 2009
This is an open-access article distributed under the terms of the Creative Commons Public Domain declaration which stipulates that, once placed in the public domain, this work may be freely reproduced, distributed, transmitted, modified, built upon, or otherwise used by anyone for any lawful purpose.
This is an open-access article distributed under the terms of the Creative Commons Public Domain declaration which stipulates that, once placed in the public domain, this work may be freely reproduced, distributed, transmitted, modified, built upon, or otherwise used by anyone for any lawful purpose.
Funding: This research was funded as part of the MESUR project (http://www.mesur.org/) by the Andrew W. Mellon Foundation. The funders had no role in study design, data collection and analysis, decision to publish, or preparation of the manuscript.
Competing interests: The authors have declared that no competing interests exist.
Sunday, April 12, 2009
Ross Store Growth - Temporal Mapping

Full credits to Flowing Data - another neat map expose - themed over time - of store growth over the company's life.
Still Not Cool Enough for FaceBook
 This Cool visual display of Facebook growth - by time & linkage concentrations - comes from a mix of Facebook, the New york Times, and the brilliant site Flowing Data.
Even at 200 million users, I'm still not "cool enough" for FaceBook. Honestly, keeping up with family, work, school, LinkedIn., my own site and the demanding readership (0.2 readers & growing) on this blog - I'm a bit "socialed out".
References / Credits:
Cool Geo-Pic: There's a Hole in the Ocean

This Cool Geo-Pic comes again from NASA's Earth Observatory.
Great Blue Hole, BelizePosted April 3, 2009
download large image (4 MB, JPEG) acquired March 24, 2009

Quick "Cut & Paste" Highlights:
" ...Surrounded by darker, deeper ocean waters, coral atolls often glow in vibrant hues of turquoise, teal, peacock blue, or aquamarine. Belize’s Lighthouse Reef Atoll fits this description, with its shallow waters covering light-colored coral: the combination of water and pale corals creates varying shades of blue-green. Within this small sea of light colors, however, lies a giant circle of deep blue. Roughly 300 meters (1,000 feet) across and 125 meters (400 feet) deep, the feature is known as the Great Blue Hole...."
" ...Believed to be the world’s largest feature of its kind, the Great Blue Hole is part of the larger Belize Barrier Reef Reserve System, a World Heritage site of the United Nations Educational, Scientific and Cultural Organization (UNESCO)....."
Full Article - Click Here
References / Credits:
Full Article - Click Here
References / Credits:
Belize Audubon Society. (2008). Blue Hole Natural Monument. Accessed April 2, 2009.
ASTER. (2009, January 23). Great Blue Hole, Belize. Jet Propulsion Laboratory. Accessed April 2, 2009.
World Heritage. (2009). Belize Barrier Reef Reserve System. UNESCO. Accessed April 2, 2009.
NASA image created by Jesse Allen, using EO-1 ALI data provided courtesy of the NASA EO-1 Team. Caption by Michon Scott.
NASA image created by Jesse Allen, using EO-1 ALI data provided courtesy of the NASA EO-1 Team. Caption by Michon Scott.
Instrument: EO-1 - ALI
Cool Geo-Pic - Mt Redoubt, AK

This Cool Geo-Pic comes again from NASA's Earth Observatory. They don't have these in Louisiana!
Mt. Redoubt Volcano, Alaska
download large image (5 MB, JPEG) acquired March 26, 2009

Quick "Cut & Paste" Highlights:
" ...After weeks of heightened seismic activity, Alaska’s Redoubt Volcano began erupting explosively on the night of March 22, 2009. On March 26, 2009, the volcano erupted again, sending a column of ash some 19,800 meters (65,000 feet) above sea level, and sending a lahar—a slurry of water and volcanic debris—through the Drift River Valley....."
" ....Redoubt is a stratovolcano composed of alternating layers of hardened lava, solidified volcanic ash, and debris produced by earlier eruptions. Sitting on the western side of Cook Inlet, the volcano rises to a height of 3,106 meters (10,197 feet). It is part of the Pacific “Ring of Fire”—a horseshoe–shaped zone of heightened seismic activity around the Pacific Ocean Basin..."
Full Article - Click Here
References / Credits:
Alaska Volcano Observatory. (2009, March 26). Alaska Volcano Observatory Current Status Report. Accessed March 31, 2009.
Global Volcanism Program. Redoubt. Smithsonian Institution. Accessed March 31, 2009.
NASA image created by Jesse Allen, using data provided courtesy of the USGS Land Remote Sensing Program. Caption by Michon Scott.
Instrument:
Landsat 5 - TM
Subscribe to:
Posts (Atom)